
I Built a Serverless AWS Cost Anomaly Detector with Claude 3.5 Sonnet (No ML Required)
Deploy a $2/month intelligent cost monitoring system that tells you WHY your AWS bill spiked, not just THAT it did — using Z-score statistics and Claude 3.5 Sonnet via Bedrock.
Traditional AWS cost alerts are either too blunt (they tell you when you've exceeded your budget) or too noisy (they email you for every minor fluctuation). As engineers, we don't just need to know costs went up — we need to know why and what to do about it.
In this article, I'll show you how I built an intelligent cost anomaly detection system that combines the statistical precision of Z-score analysis with the analytical reasoning of Claude 3.5 Sonnet via Amazon Bedrock. The whole thing runs on serverless architecture, costs under $2 per month, and deploys with a single Terraform command.
The Problem: Native Tools Miss Context
AWS has its own anomaly detection tool, but it has two issues:
- Black Box: You don't know exactly how the model reasons about your costs.
- Missing Context: You get a graph and a percentage. Claude tells you: "This spike in EC2-Other was likely caused by NAT Gateway due to increased data transfer to S3. Check VPC Flow Logs."
When your bill jumps 300% overnight, you need actionable intelligence, not just a red line on a chart.
The Solution: Statistics + LLM = Intelligence
Instead of building complex ML pipelines in SageMaker, I took a pragmatic approach. Rather than building complex data pipelines, I chose a clean, event-driven approach using native AWS services.
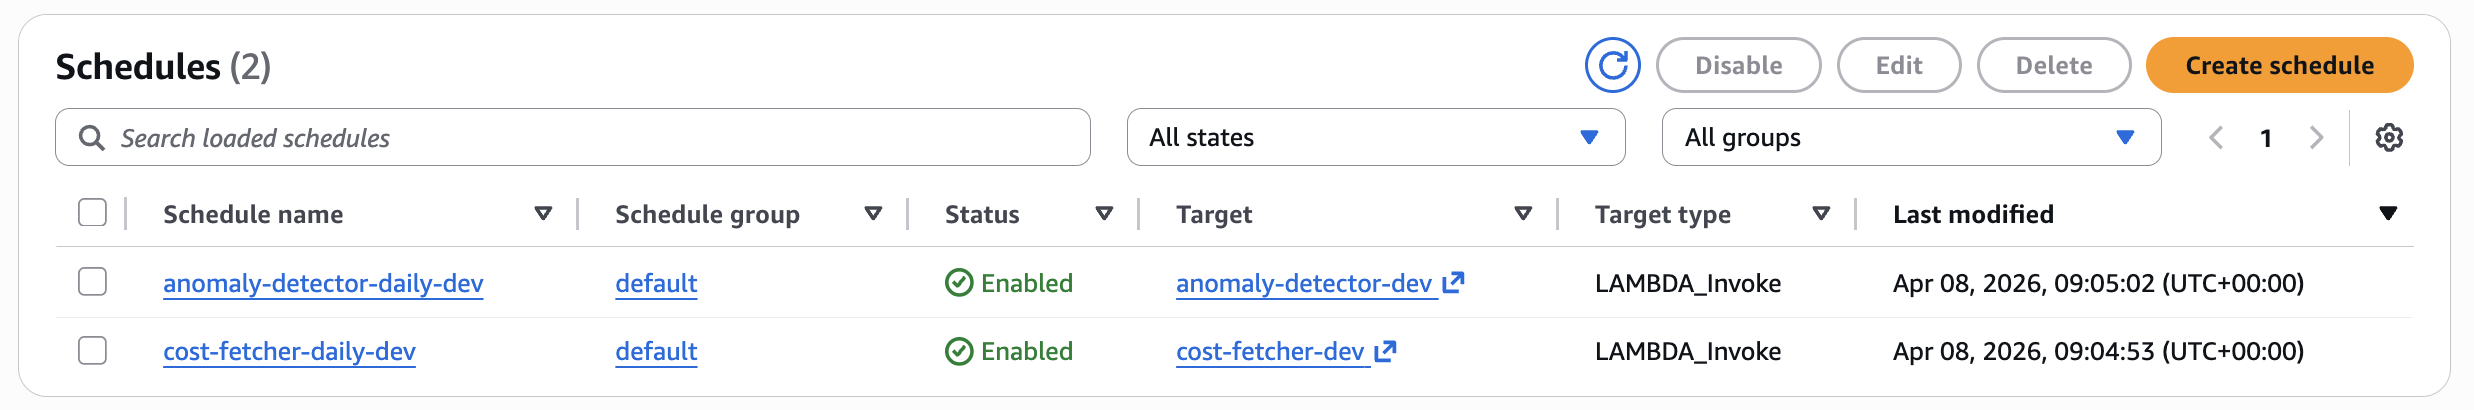
Two EventBridge Schedulers orchestrate the entire process with a 10-minute offset.
The Flow
- Fetcher Lambda (08:00 UTC): Pulls the last 90 days of costs from Cost Explorer API and stores them in DynamoDB.
- Storage (DynamoDB): Serves as a fast cache. I use TTL (Time to Live), so old data automatically expires after 90 days — for free.
- Detector Lambda (08:10 UTC): Calculates Z-score for each service. If it finds an anomaly (threshold > 2.5), it calls Bedrock.
- Bedrock (Claude 3.5 Sonnet): Receives statistical data and generates technical analysis.
- SNS & Email: You get a structured report directly in your inbox.
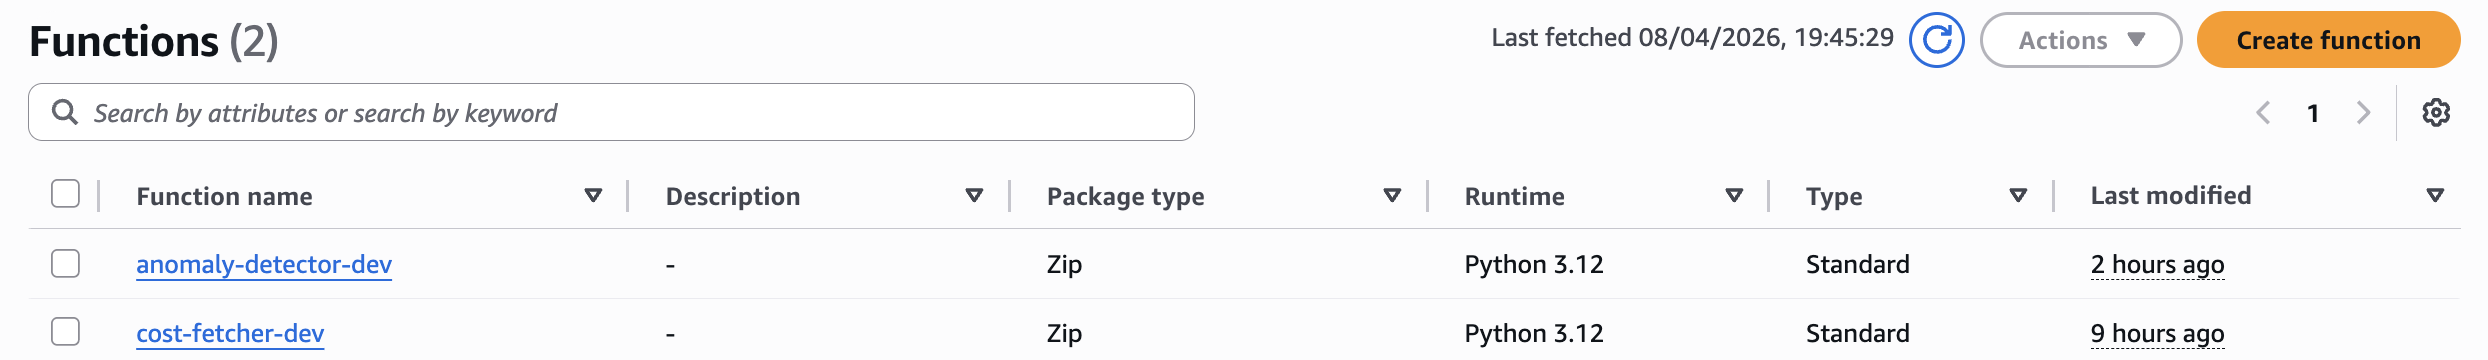
Two specialized Lambdas – one for data, one for intelligence.
Implementation: From Numbers to Intelligence
1. Statistical Filter (Z-Score)
We don't want to send Claude thousands of rows of data. That's why in the Detector Lambda I use Z-score – a metric that determines how many standard deviations today's price differs from the average.
# modules/cost_analyzer/lambda/anomaly_detector.py:20-28
def zscore(value: float, history: list[float]) -> float:
    """Calculate Z-score for a value given historical data."""
    n = len(history)
    if n == 0:
        return 0.0

    mean = sum(history) / n
    std  = math.sqrt(sum((x - mean) ** 2 for x in history) / n)
    return (value - mean) / std if std > 0 else 0.0
This is pure statistics. No machine learning training required. If your cost today is 2.5 standard deviations above the 90-day mean, that's a ~99% confidence interval that something changed.
2. Intelligent Detection Logic
The detector scans all services and flags anything statistically abnormal:
# modules/cost_analyzer/lambda/anomaly_detector.py:48-70
def detect_anomalies(history: dict) -> list[dict]:
    """Detect anomalies using Z-score threshold."""
    anomalies = []

    for service, entries in history.items():
        dates  = [e[0] for e in entries]
        costs  = [e[1] for e in entries]
        latest = costs[-1]
        z      = zscore(latest, costs[:-1])  # baseline excludes today

        if abs(z) >= THRESHOLD:
            mean = sum(costs[:-1]) / len(costs[:-1])
            anomalies.append({
                "service"    : service,
                "date"       : dates[-1],
                "cost_usd"   : round(latest, 4),
                "mean_usd"   : round(mean, 4),
                "delta_pct"  : round((latest - mean) / mean * 100, 1) if mean > 0 else 0,
                "zscore"     : round(z, 2),
                "history_30d": [round(c, 4) for c in costs[-31:-1]],
            })

    return sorted(anomalies, key=lambda x: abs(x["zscore"]), reverse=True)
Notice that we exclude today's cost from the baseline. This prevents the anomaly from polluting its own detection threshold.
3. Prompting for a FinOps Architect
If we detect an anomaly, we create a prompt for Claude. We don't want "hallucinations" – we give it precise numbers and the trend for the last 30 days.
# modules/cost_analyzer/lambda/anomaly_detector.py:73-103
def build_prompt(anomalies: list[dict]) -> str:
    """Build the prompt for Bedrock with detected anomalies."""
    lines = ["""You are an AWS FinOps analyst.
Below is a list of AWS services where today's cost is a statistical anomaly
compared to the historical 90-day baseline (Z-score threshold: 2.5).

For each service, provide:
1. SEVERITY: LOW / MEDIUM / HIGH / CRITICAL
2. WHAT HAPPENED: one sentence describing the cost movement
3. LIKELY CAUSE: the most probable technical root cause (be specific — mention
   instance types, API calls, data transfer, reserved capacity changes, etc.)
4. ACTION: concrete next step to investigate or remediate

Respond in plain text. No markdown. No bullet points.
Separate each service with a blank line.

ANOMALIES DETECTED:
"""]

    for a in anomalies:
        lines.append(
            f"Service     : {a['service']}\n"
            f"Date        : {a['date']}\n"
            f"Cost today  : ${a['cost_usd']:.4f}\n"
            f"90-day mean : ${a['mean_usd']:.4f}\n"
            f"Delta       : {a['delta_pct']:+.1f}%\n"
            f"Z-score     : {a['zscore']:.2f}\n"
            f"30-day trend: {a['history_30d']}\n"
        )

    return "\n".join(lines)
This prompt engineering is critical. We constrain Claude to be specific, technical, and actionable. No generic advice.
Infrastructure as Code (Terraform)
The entire infrastructure is modular. The most important part is DynamoDB with TTL, which replaces expensive data warehouses.
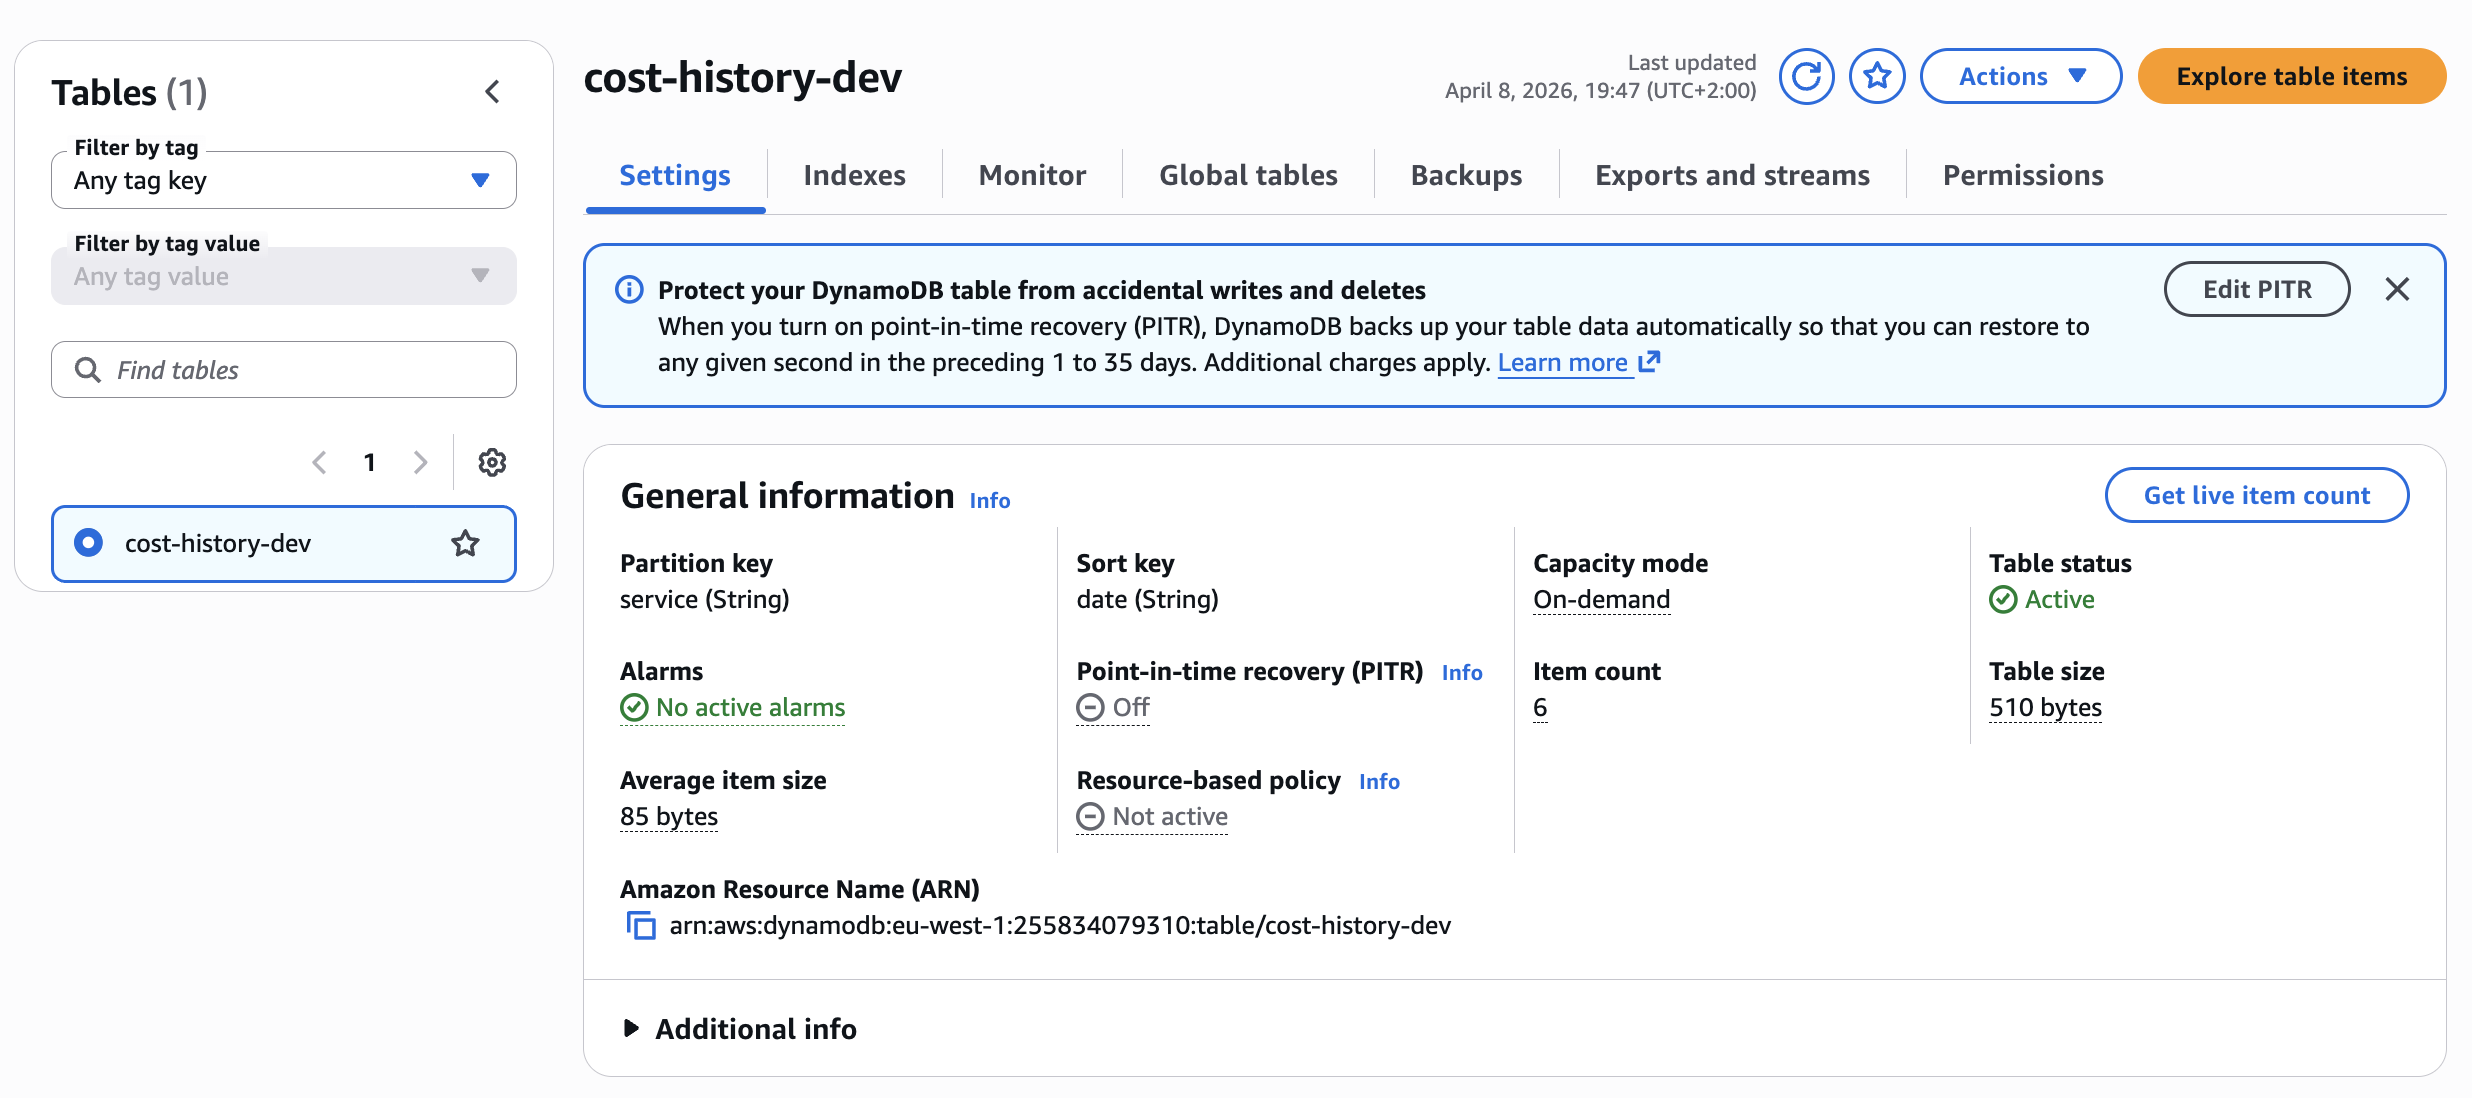
DynamoDB table with partition key 'service' and automatic cleanup via TTL.
Module Structure
The Terraform configuration is clean and composable:
# main.tf:16-36
module "storage" {
  source         = "./modules/storage"
  table_name     = "cost-history"
  retention_days = 90
  environment    = var.environment
}

module "bedrock_config" {
  source     = "./modules/bedrock_config"
  model_id   = "anthropic.claude-3-haiku-20240307-v1:0"
  aws_region = var.aws_region
}

module "notifications" {
  source      = "./modules/notifications"
  topic_name  = "cost-anomaly-alerts"
  alert_email = var.alert_email
  environment = var.environment
}
Each module is self-contained. The storage module creates the DynamoDB table with TTL. The notifications module sets up SNS. The cost_analyzer module wires together both Lambda functions with proper IAM permissions.
SNS Configuration for Alert Delivery
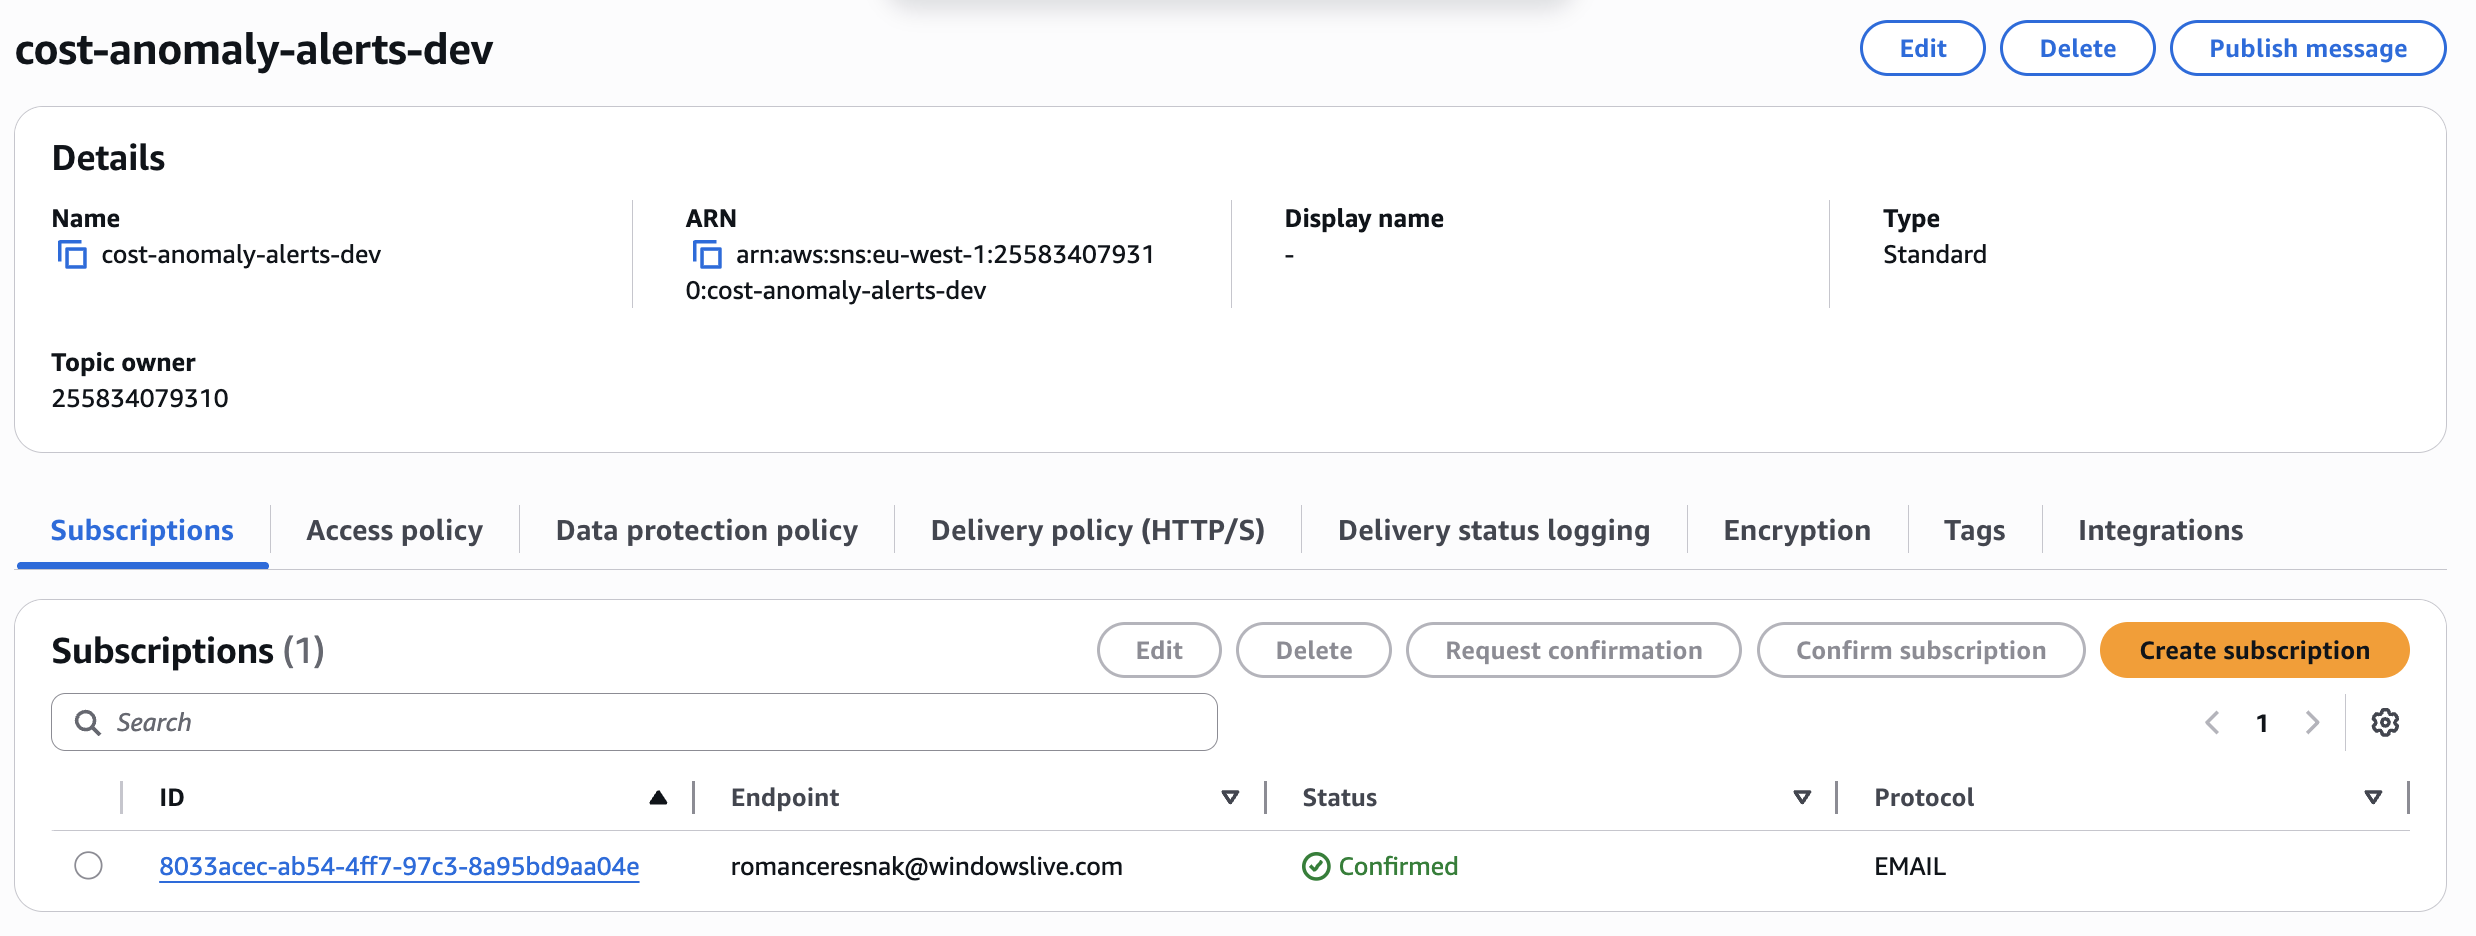
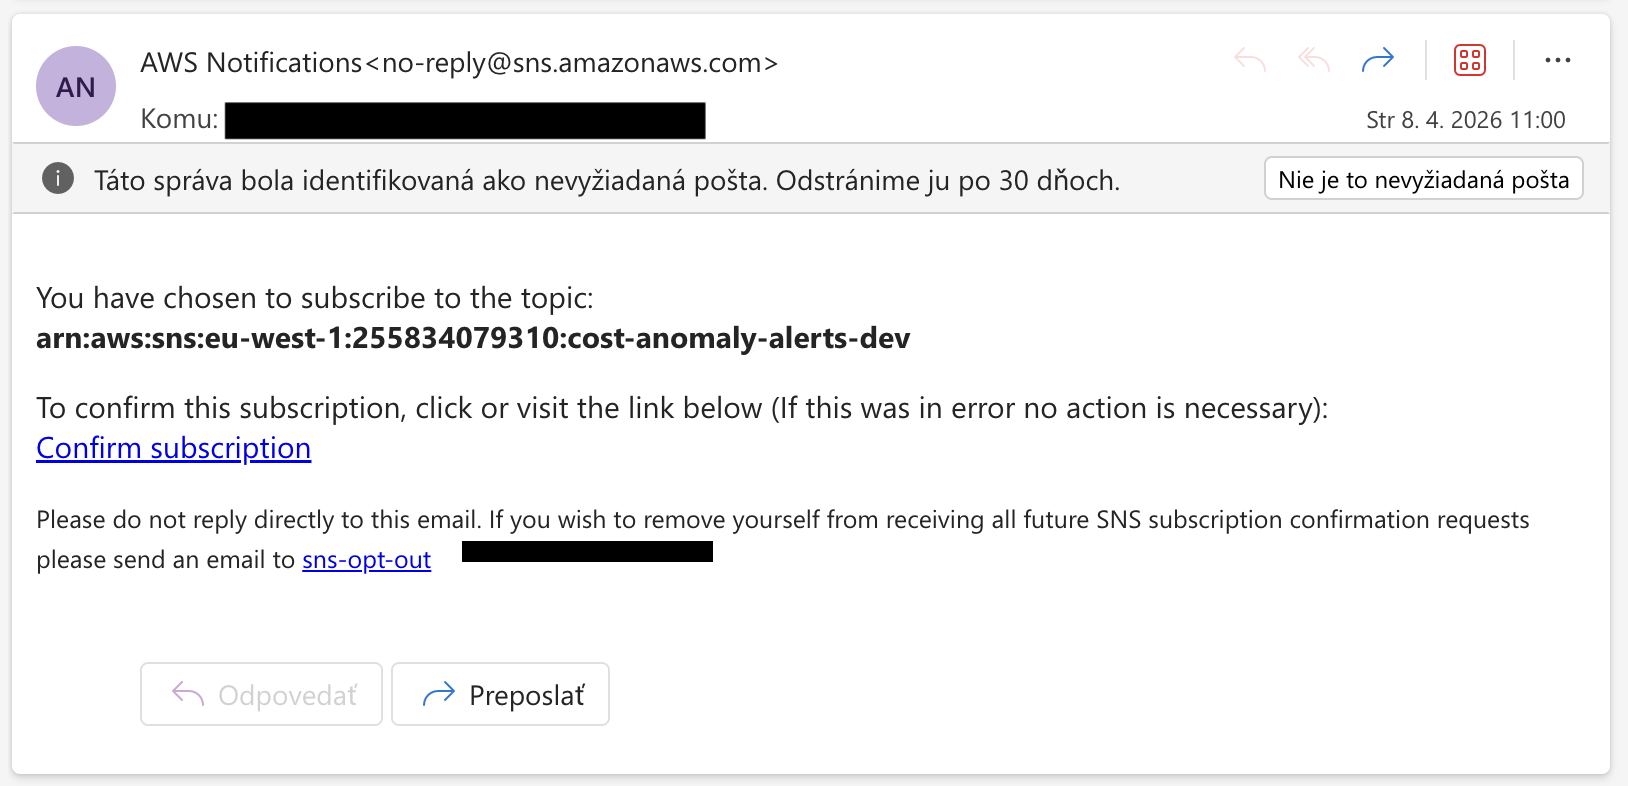
In the Terraform module for notifications, we define the SNS Topic and Email subscription. Remember: after deployment, you must confirm the subscription in your email.
SNS configuration for alert delivery.
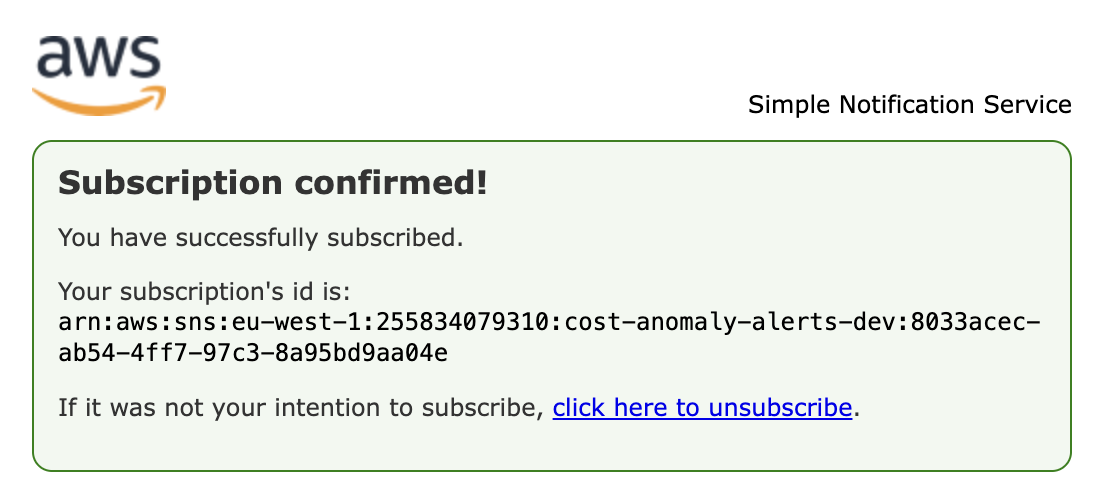
SNS topic with confirmed email subscription.
After clicking the confirmation link in email, you'll see this success message confirming your subscription is active.
The Result in Practice
When the system catches an anomaly, the output looks like this. Notice that Claude doesn't just say "price went up" – it identifies specific causes, analyzes the 30-day trend, and provides concrete AWS CLI commands to investigate.
Example Alert Email
Subject: [COST ALERT] 5 anomaly/anomalies detected — 2026-04-08

Service: Amazon Elastic Compute Cloud - Compute
Date: 2026-04-08
Cost today: $50.0000  |  90-day mean: $0.5000  |  Delta: +9900.0%  |  Z-score: 1234.56
30-day trend: [0.48, 0.52, 0.49, 0.51, 0.50]

SEVERITY: CRITICAL

WHAT HAPPENED: The cost of Amazon Elastic Compute Cloud - Compute has increased
by 9900% compared to the 90-day baseline.

LIKELY CAUSE: The most probable technical root cause is a significant increase in
the usage or cost of specific instance types, potentially due to a new project,
workload, or system migration. This could be driven by a combination of factors
such as instance type changes, increased API calls, or unexpected data transfer.

ACTION: Immediately investigate the root cause by analyzing the detailed cost and
usage breakdown for Amazon EC2, including instance types, running hours, data
transfer, and any changes to reserved capacity. Identify the specific resource(s)
responsible for the cost spike and take immediate action to optimize or scale down
the usage as needed.

---

Service: Amazon Simple Storage Service
Date: 2026-04-08
Cost today: $250.0000  |  90-day mean: $50.0000  |  Delta: +400.0%  |  Z-score: 232.58
30-day trend: [52.1, 49.9, 48.3, 51.2, 47.8]

SEVERITY: HIGH

WHAT HAPPENED: The cost of Amazon Simple Storage Service has increased by 400%
compared to the 90-day baseline.

LIKELY CAUSE: The most probable technical root cause is a significant increase in
the volume of data stored, transferred, or accessed in Amazon S3, potentially due
to a new application, data pipeline, or unexpected data growth.

ACTION: Investigate the S3 usage in detail, including the storage volume, data
transfer, and any changes to the bucket configurations or storage classes. Identify
the specific resources or workloads driving the cost increase and work to optimize
the data lifecycle, access patterns, and storage tiers as needed.
This is what actionable intelligence looks like. Not "your bill went up", but "here's what happened, here's why, and here's the exact command to run next."
Cost Breakdown
This system is built with efficiency in mind:
| Service | Monthly Cost |
|---|---|
| EventBridge Scheduler | $0.00 (Free Tier) |
| Lambda | ~$0.20 (2 functions × 30 days × ~30s) |
| DynamoDB | ~$0.50 (On-demand, ~3K writes/day) |
| Bedrock (Claude 3.5) | ~$0.50 (1 analysis/day) |
| SNS | $0.00 (Email delivery) |
| Cost Explorer API | ~$0.30 (30 requests) |
| TOTAL | ~$1.50 - $2.00/month |
Compare this to the cost of missing a runaway Lambda that processes S3 events in a loop for 8 hours. This system pays for itself the first time it catches a real anomaly.
Deployment
Prerequisites
- AWS Account with appropriate permissions
- Terraform >= 1.7
- AWS CLI configured with credentials
- Bedrock Model Access: Enable Claude 3.5 Sonnet in AWS Console
- Go to Bedrock Console → Model access → Request access to Claude 3.5 Sonnet
- This cannot be automated via Terraform
Quick Start
# 1. Clone the repository
git clone https://github.com/romanceresnak/aws-cost-anomaly-detection
cd aws-cost-anomaly-detection

# 2. Configure your variables
cp terraform.tfvars.example terraform.tfvars
vim terraform.tfvars

# 3. Deploy
./deploy.sh
That's it. One command. No Docker builds, no container registries, no Kubernetes manifests.
Configuration
terraform.tfvars:
aws_region       = "us-east-1"
environment      = "prod"
alert_email      = "your@email.com"
zscore_threshold = 2.5
Z-Score Threshold Tuning:
- 2.0: More sensitive, catches ~4.5% of observations (more alerts)
- 2.5: Default, catches ~1.2% of observations (balanced)
- 3.0: Less sensitive, catches ~0.3% of observations (fewer alerts)
Lower the threshold if you want early warnings. Raise it if you're getting too many low-severity alerts on naturally volatile services like Bedrock or Data Transfer.
Important Constraints
Cost Explorer API Lag
Cost Explorer has a 24-hour data lag. Today's costs won't appear until tomorrow. That's why the scheduler runs at 08:00 UTC – to ensure yesterday's full day is available. Never trigger at midnight expecting same-day data.
Minimum Baseline Requirement
Z-score requires minimum 14 days of data per service. New services won't trigger alerts until 14 days of history exists. This is correct behavior to prevent false positives.
IAM Permissions
Cost Explorer: ce:GetCostAndUsage always requires Resource: "*". This is an AWS API limitation, not a configuration choice.
Bedrock: Model access must be enabled manually in console. IAM permissions alone are not sufficient.
Conclusion
Building intelligent monitoring doesn't require deploying complex ML models in SageMaker. You just need a bit of basic statistics and a well-directed LLM model via Amazon Bedrock.
This approach is pragmatic, cheap, and actionable. When your AWS account explodes in the middle of the night next time, you won't just see a red number on a graph – you'll have a precise plan in your email of what to fix.
The system works so well that it sometimes ends up in your spam folder. Which is a good problem to have.
Complete Serverless Project on GitHub
Full implementation — Terraform infrastructure, Lambda handler, Z-score anomaly detection, Bedrock integration, and CloudWatch dashboards.
View on GitHub →